A first look from NASA’s new air pollution satellite
Although air pollution has improved over the years, “one-third of Americans are still living in unhealthy levels of air pollution,” said Xiong Liu, the deputy mission director and a physicist at the Center for Astrophysics.
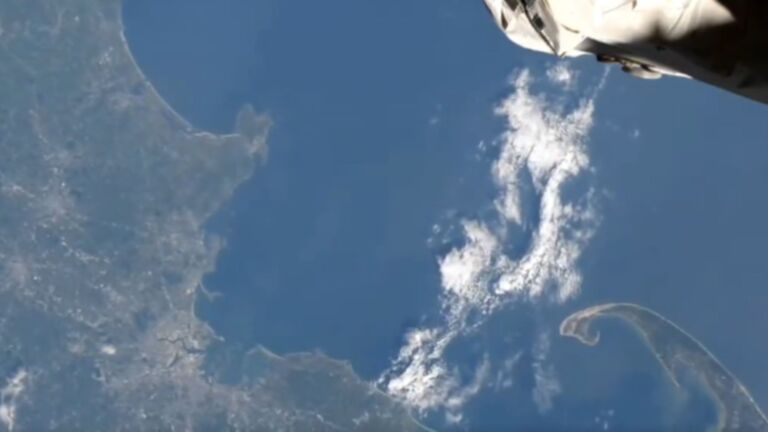
When scientists switched on the instrument aboard a new satellite this summer, they got a preview of what will soon be the nation’s first continuous record of air pollution.
The satellite will stay parked above North America and provide scientists with hourly daytime updates on air pollution nationwide. On Thursday, researchers released their first images, which show changes in nitrogen dioxide pollution over the United States over the course of a day.
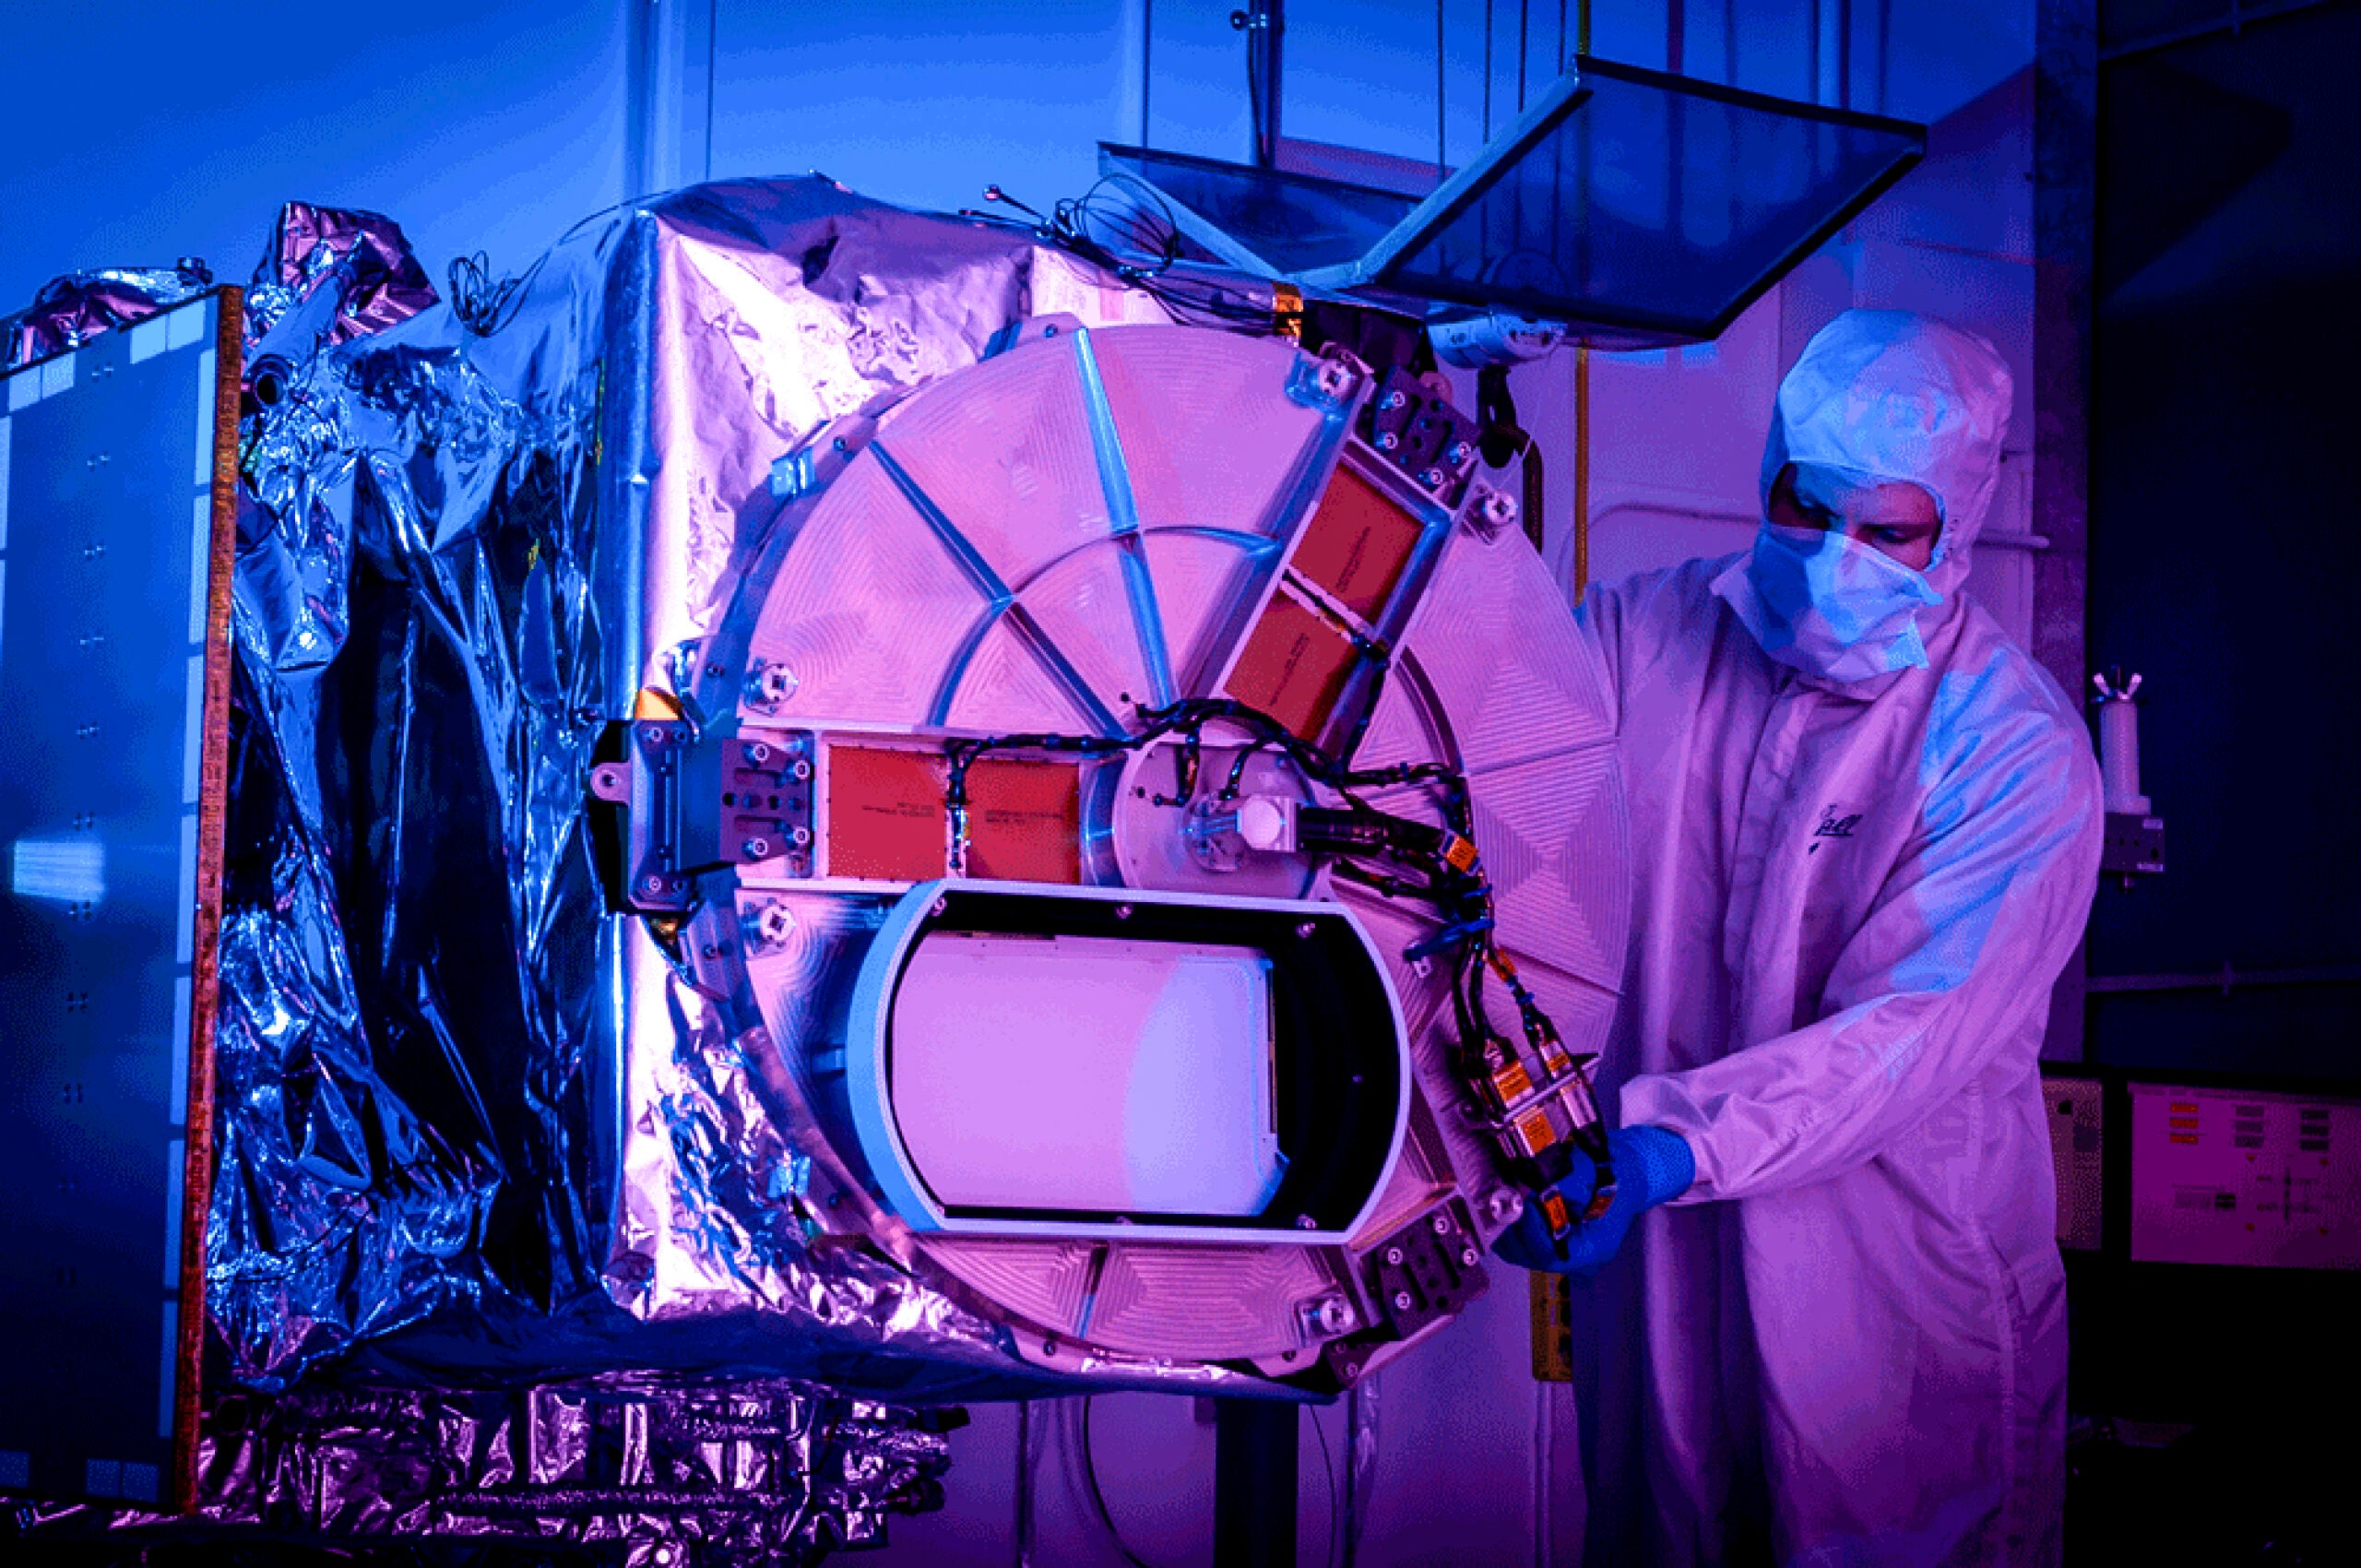
“It’s really exciting to see the instrument just working as expected,” said Xiong Liu, the deputy mission director and a physicist at the Center for Astrophysics run by Harvard University and the Smithsonian Institution. The satellite instrument, called TEMPO, will be able to measure several other pollutants as well.
More space news:
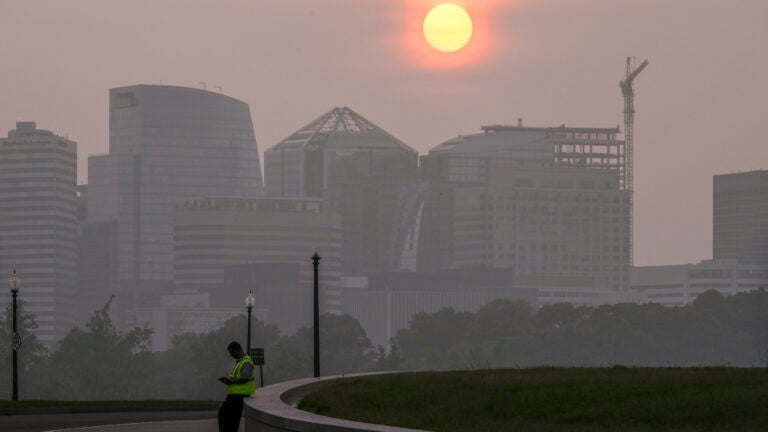
The images come during a summer of exceptionally bad air quality for the United States, with smoke from wildfires blanketing multiple cities and regions. But even before this summer, over the past decade or so, the gains in air quality that Americans have enjoyed since the passage of the Clean Air Act in 1970 had started to plateau.
Although air pollution has improved over the years, “one-third of Americans are still living in unhealthy levels of air pollution,” Liu said.
Nitrogen dioxide comes from burning fuel and creates other types of pollution through chemical reactions in the air. The images show clear hot spots of the gas around major cities, with higher levels during the morning and evening when there’s more traffic.
In addition to peering down on Earth via the new satellite, scientists fanned out across the country on foot and in research planes this July and August, in a tightly choreographed production to try to understand why air quality was no longer improving.
Because pollutants can quickly travel thousands of miles on the wind, it has been hard for scientists to pinpoint the biggest sources of pollution on a national scale. TEMPO’s hourly updates are expected to be a “real game changer” in giving researchers the ability to track air pollution from its source, said Brian McDonald, an environmental engineer with the National Oceanic and Atmospheric Administration who is coordinating this summer’s field research with the satellite.
Car traffic has historically been one of the biggest contributors to air pollution, but tighter emissions standards for motor vehicles have reduced pollution from driving. At the same time, the relative importance of consumer products and materials that emit pollutants known as volatile organic compounds has gone up, McDonald said.
These compounds react with nitrogen dioxide in the air to create harmful ground-level ozone, which has remained stubbornly high in some places, especially in California and in major metropolitan areas across the country. Although the ozone layer high in the atmosphere protects us from cancer-causing ultraviolet radiation, ozone near the ground can aggravate or cause respiratory diseases such as asthma, bronchitis and emphysema.
Another persistent problem is fine particulate pollution, made of microscopic particles small enough to enter the bloodstream and cause heart and lung disease, strokes and even premature death in severe cases. This pollution, also known as PM2.5, started increasing again around 2016 after years of decline.
Wildfires, which are becoming more frequent and more intense as climate change creates hotter and drier conditions, appear to be the main culprit behind this reversal, according to a study published last fall.
That research relied on an older satellite that provides daily measurements, said Marshall Burke, a professor of environmental policy at Stanford University and one of the authors of the study. He and his colleagues rely heavily on computer models of how pollutants move with the wind to fill in the blanks between actual observations.
Burke, who is not involved in the TEMPO mission, is looking forward to having hourly data from the satellite, which will be “closer to a video,” he said. “As you have more and more images, it’s much easier to fill in the map of where things came from,” he added.
TEMPO will be able to track air pollution down to a resolution of about 4 square miles. That’s where this summer’s coordinated flights, drives and walks come in.
“The data from these field campaigns acts like a decoder ring” for the satellite instrument, said Tracey Holloway, a professor of energy analysis and policy at the University of Wisconsin-Madison who studies air quality but is not involved in this project.
One of the places scientists are gathering data at a granular local level is New York City. Even cities that routinely monitor their air don’t typically have enough equipment to cover all neighborhoods. That’s a problem because within individual cities or regions, air pollution tends to be unevenly distributed.
Since late July, a dozen researchers led by Audrey Gaudel and Prathap Ramamurthy of NOAA have taken turns walking in pairs around the city, carrying a backpack full of buzzing air quality sensors. Onlookers frequently asked if the scientists were going fishing, because of the long, skinny tubes that stick out of the pack to suck in air samples.
Each day, one colleague tracked the flight paths of NASA’s research aircraft and gave updates on WhatsApp so the trekkers could walk underneath the planes. The data sets would be compared later. The researchers have covered a dozen routes, making sure to include economically disadvantaged neighborhoods and neighborhoods with more residents of color. These areas often face disproportionate air pollution, but have sparse data.
“We’re hoping to have better models and better prediction on the street level,” said Yoshira Ornelas Van Horne, a professor of environmental health at Columbia University and another TEMPO collaborator.
It will take a few months to analyze all the data, but the walks themselves have already highlighted the connection between climate change and air quality. (Ramamurthy said some of the hourslong walks at the height of summer were “horrible.”) Higher temperatures are generally associated with higher levels of ozone pollution, and on the hottest sampling day, ozone readings rose above the national standards set by the Environmental Protection Agency, Gaudel noted.
Data from the TEMPO satellite should be available to the general public this spring. In the meantime, more than 400 users, including many state and federal agencies, have signed up as “early adopters.”
Researchers at the Mount Sinai Health System in New York plan to use TEMPO data to study how air pollutants affect children’s asthma symptoms. The Connecticut Bureau of Air Management plans to use the data to investigate where the state’s unusually high ozone pollution comes from.
Ornelas Van Horne hopes this summer’s research will arm policymakers with the information needed to do something about the nation’s lingering air quality problems. “We’re all in agreement that air pollution is bad,” she said.
This article originally appeared in The New York Times.


Conversation
This discussion has ended. Please join elsewhere on Boston.com